
Global Sea Level Change and
Dynamic Ocean Topography
How fast is the sea level rising?
Global sea level change refers to the temporal variation in the globally averaged height of the ocean surface. It is quantified by changes in the Global Mean Sea Level (GMSL), derived primarily from satellite altimetry observations. Global sea level change reflects variations in ocean mass, resulting from processes such as the melting of glaciers and ice sheets and changes in terrestrial water storage, together with changes in seawater density caused by variations in temperature and salinity (steric effects). Dynamic Ocean Topography (DOT) quantifies the regional variations in sea surface height relative to the geoid, providing information on ocean circulation and the spatial redistribution of ocean mass. Like GMSL, DOT is derived from satellite altimetry observations in combination with an accurate geoid model, but it characterises a different aspect of sea level variability. Together, GMSL and DOT provide complementary information. While changes in GMSL quantify the overall rise or fall of the global ocean, reflecting changes in ocean mass and steric expansion, DOT describes the spatial distribution of sea surface height relative to the geoid, revealing the effects of ocean circulation and regional mass redistribution.
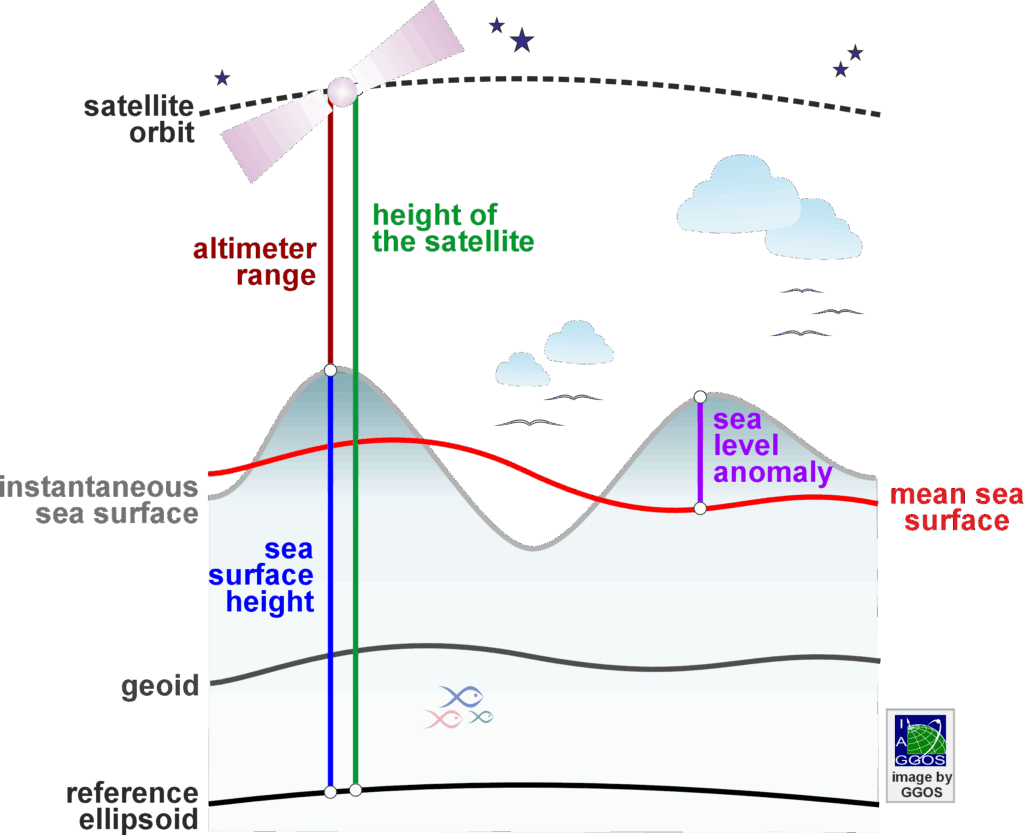

The monitoring of sea level changes with satellite altimetry is relatively recent (since the early 1990s). Satellite altimeters cover the ocean areas with repeated tracks at repetition rates of some days up to a month and permit the estimation of sea surface heights to an accuracy of 1 to 2 cm.
Geographical averaging of individual sea surface heights allows estimating a global mean sea level value, and further constructing a global mean sea level time series. As the satellites follow the same ground tracks in every repetition, it is also possible to infer local or regional sea level time series to analyse the sea level variability at short spatial scales and at different time scales.
The accuracy of the global mean rate of sea level rise inferred from satellite altimetry is assessed to be about 0.4 to 0.5 mm/yr. The estimated sea level change trends differ with respect to the used data sets, the considered time span, and the processing strategies and methods.
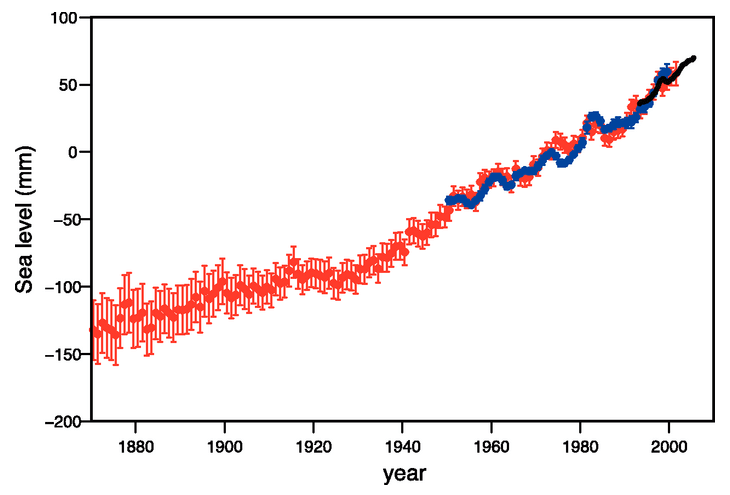
Sea level is also monitored in situ at specific coastal locations using tide gauges. Because tide gauges are attached to the Earth’s crust, they measure changes in the height of the sea surface relative to the land on which they are installed. Consequently, their observations include both changes in sea level and vertical land motion. Tide gauge measurements are referenced to local tide gauge benchmarks and are typically expressed in a local vertical datum. They therefore quantify relative sea level change. [Link to the new product page relative-mean-sea-level]
Data Sources
The original altimetry data measured by the individual satellite altimetry missions are provided by the responsible space agencies. Some of them also provide pre-processed sea surface heights (so-called Level-3 or Level-4 products). Refined solutions are computed by different agencies, universities and research institutes. Selected data sources are:
- Radar Altimetry Tutorial and Toolbox: at the European Space Agency (ESA) and Centre National d’Etudes Spatiales (CNES)
- Ocean Surface Topography from Space: at the US National Aeronautics and Space Administration (NASA)
- AVISO+ satellite altimetry data: at the Centre National d’Etudes Spatiales (CNES) and the Center for Topographic studies of the Ocean and Hydrosphere (CTOH)
- Altimetric and Ocean Surface Topography: Data Information at the US National Aeronautics and Space Administration (NASA) and National Oceanic and Atmospheric Administration (NOAA)
- Copernicus: European Union’s Earth Observation Programme Copernicus